Income Deprivation Affecting Children Index (IDACI)
Income Deprivation affecting Children Index (IDACI) measures the proportion of all children aged 0 to 15 living in income deprived families. It is a subset of the Income Deprivation domain which measures the proportion of the population in an area experiencing deprivation relating to income.
IDACI is a useful indicator to understand the levels of deprivation in an areas, specific to those aged 0-15 and can be useful to evidence need in a specific area of the City.
Nottingham ranks 6th most deprived out of the 317 districts in England using the IDACI Average Score measure. This compares with 4th in 2015.
- Local Authorities which rank as more deprived than Nottingham using the Average Score measure are
- Middlebrough
- Blackpool
- Knowsley
- Liverpool
- Kingston upon Hull
- Of these, just Middlesbrough ranked as more deprived than the City in 2015, the other districts were Tower Hamlets (ranking 1st in 2015 and 14th in 2019) and Islington (ranking 3rd in 2015 and 10th in 2019).
- Nottingham ranks second most deprived of the Core Cities behind Liverpool (4th out of 317).
- The others rank as follows: Manchester (7th); Birmingham (9th); Newcastle upon Tyne (24th); Sheffield (49th); Bristol (64th); and Leeds (70th).
Changes between 2015 and 2019
- The ‘scores’ for IDACI are the proportion of children in an area experiencing Income Deprivation.
- 29.8% of children in Nottingham (17,600) are affected by income deprivation. This is a decrease on both the 2015 and 2010 indices which suggested 34.5% and 39% of children respectively were affected.
- Around 1,800 fewer children in Nottingham experience Income Deprivation in 2019, a 9.5% decrease, greater than all the Core Cities except Bristol (a 13% decrease).
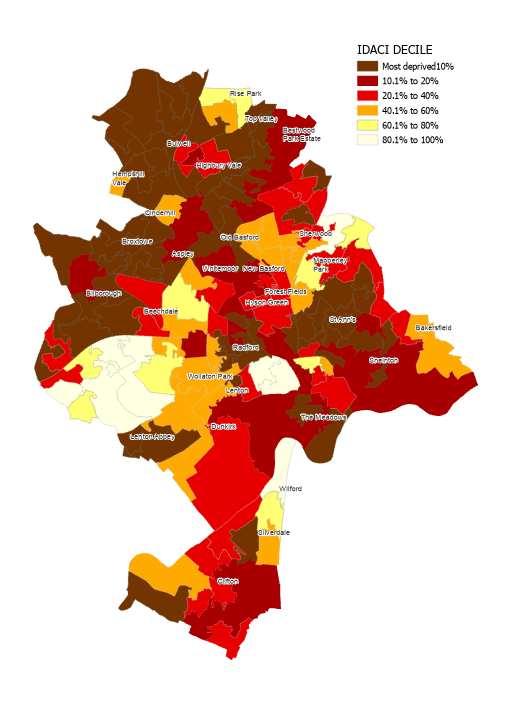
The Income Deprivation Affecting Children Index LSOA Results
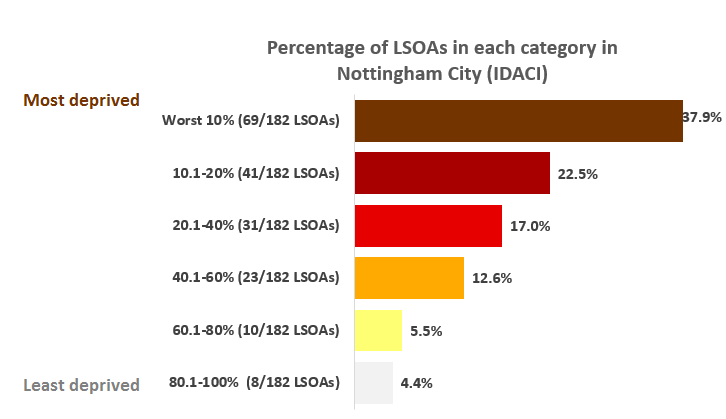
- In the IDACI LSOA Results, 69 of the 182 City LSOAs (37.9%) fall amongst the 10% most deprived in the country. 110 fall in the 20% most deprived (60.4%). This compares to 68 and 108 LSOAs in the 2015 indices.
- As shown on the table below, 9 LSOAs have dropped out of the 10% most deprived and 10 have fallen into this decile.
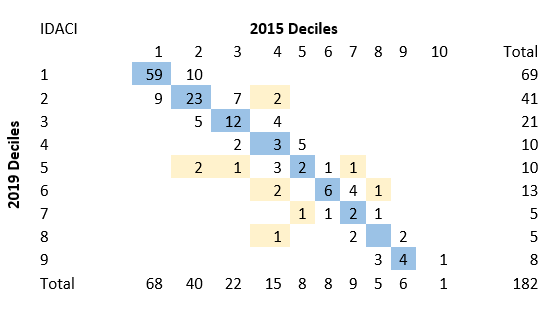
- 32 LSOAs have improved by a decile or more, and 39 have got relatively more deprived by a decile or more.
- There are similar numbers of LSOAs ranking within the worst 10% and 20% nationally compared to 2015, which suggests, that, even though Nottingham has seen fewer children affected by income deprivation, so have other areas.
- The lowest ranking LSOA in the City is in Aspley – in the North West of the Broxtowe Estate, which ranks 169th nationally out of 32,844.
- All of the LSOAs in Aspley and Bestwood wards rank within the most deprived 20% nationally. Aspley has the highest proportion of children affected by income deprivation (43%), and also the highest number of children affected (2,600), because of its age-profile.
- Bulwell ward also has more than 1,500 children affected by income deprivation.
- To find out the location of a particular LSOA, we have created a web app. Simply type in a LSOA code into the search box and the map will zoom to its location.
LSOAs in the 10% most deprived in Nottingham City
To find out all Lower Super Output Areas which fall in the 10% most deprived in Nottingham City please see the following links below.
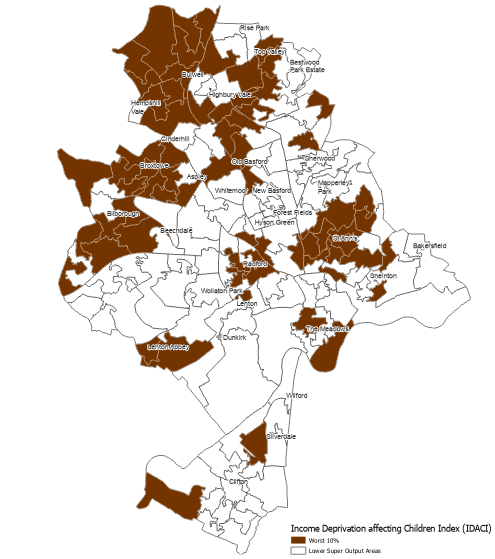
- List of 10% most deprived Lower Super Output Areas
- Map of Income Deprivation affecting Children Index (IDACI) - LSOAs in the most deprived 10%
Other resources
- Link to IDACI map (2019)
- Link to interactive IDACI map (2019)
- Indices of Deprivation (2019) summary
- Child poverty theme
- A-Z of JSNA chapters