Income Deprivation Affecting Older People Index (IDAOPI)
Income Deprivation affecting Older People Index (IDAOPI) measures the proportion of all those aged 60 or over who experience income deprivation. It is a subset of the Income Deprivation domain which measures the proportion of the population in an area experiencing deprivation relating to income.
IDAOPI is a useful indicator to understand the levels of deprivation in an areas, specific to those aged 60 or over and can be useful to evidence need in a specific area of the City.
Nottingham ranks 20th most deprived out of the 317 districts in England using the IDAOPI Average Score measure. This compares with 18th in 2015.
- Local Authorities which rank as more deprived than Nottingham using the Average Score measure are:-
- 8 London Boroughs
- Manchester
- Liverpool
- Leicester
- Knowsley
- Sandwell
- Kingston upon Hull
- Blackburn with Darwen.
- Of these, just Lewisham and Blackburn with Darwen ranked as less deprived than the City in 2015, (ranking 19th and 27th in 2015 respectively).
- Nottingham ranks fourth most deprived of the Core Cities behind Manchester (5th out of 317); Liverpool (8th); and Birmingham (14th).
- The others rank as follows: Newcastle upon Tyne (31st); Sheffield (57th); Bristol (61st); and Leeds (86th).
Changes between 2015 and 2019
The ‘scores’ for IDAOPI are the proportion of over 60’s in an area experiencing Income Deprivation.
- 23.8% of older people in Nottingham (11,800) are affected by income deprivation. This is a slight change on the 2015 indices which suggested 25.9% of older people were affected.
- Around 300 more older people in Nottingham experience Income Deprivation in 2019 than in 2015, a 2.8% increase.
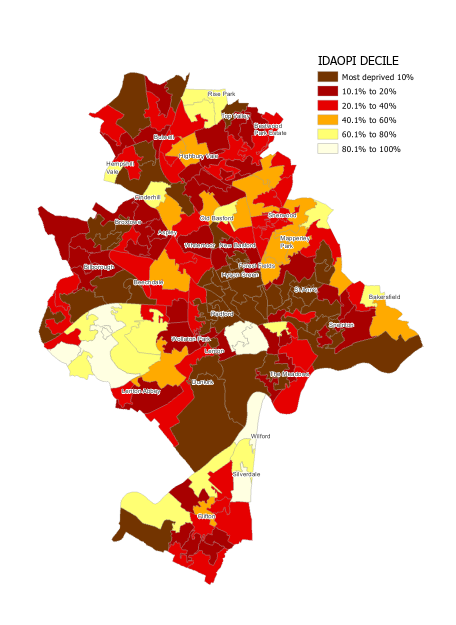
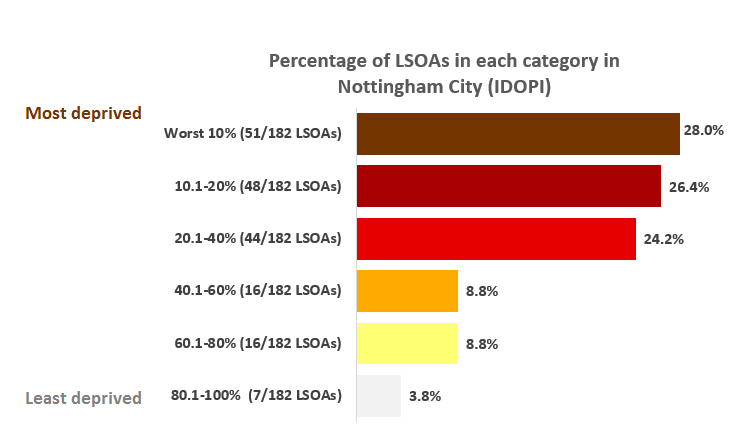
The Income Deprivation Affecting Older People Index LSOA Results
- In the IDAOPI LSOA Results, 51 of the 182 City LSOAs (28%) fall amongst the 10% most deprived in the country. 99 fall in the 20% most deprived. This compares to 48 and 95 LSOAs in the 2015 indices.
- As shown on the table below, 6 LSOAs have dropped out of the 10% most deprived and 8 have fallen into this decile.

- 23 LSOAs have improved by a decile or more, and 40 have got relatively more deprived by a decile or more.
- The lowest ranking LSOA in the City is in Hyson Green and Arboretum – around Noel Street, which ranks 104th nationally out of 32,844.
- No ward has all LSOAs in the most deprived 10%.
- Hyson Green and Arboretum, and Radford wards have the highest percentage of older people affected by income deprivation – at 43% and 46% respectively, although Bilborough ward has the highest number affected (1,240 – equivalent to 33%)
- To find out the location of a particular LSOA, we have created a web app. Simply type in a LSOA code into the search box and the map will zoom to its location.
LSOAs in the 10% most deprived in Nottingham City
To find out all Lower Super Output Areas which fall in the 10% most deprived in Nottingham City please see the following links below.
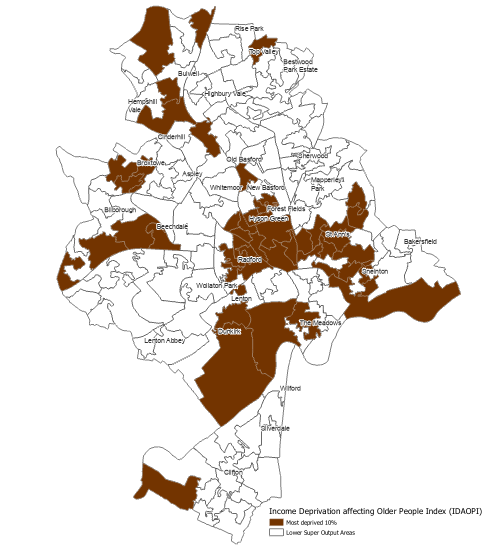
- List of 10% most deprived Lower Super Output Areas
- Map of Income Deprivation affecting Older People Index (IDAOPI) - LSOAs in the most deprived 10%
Other resources
- Link to IDAOPI Map (2019)
- Link to interactive IDAOPI map (2019)
- Indices of Deprivation (2019) Summary
- A-Z of JSNA Chapters