What are the indices of deprivation?
The most recent indices of deprivation were published on 26th September 2019.
The Indices of Deprivation measure relative levels of deprivation in 32,844 small areas or neighbourhoods, called Lower Super Output Areas (LSOAs), in England. Each area is given a score and a rank for seven distinct domains of deprivation which are combined to calculate the overall Index of Multiple Deprivation. Summaries are also provided at a Local Authority district level.
Nottingham City comprises of 182 LSOAs as shown in the map below.
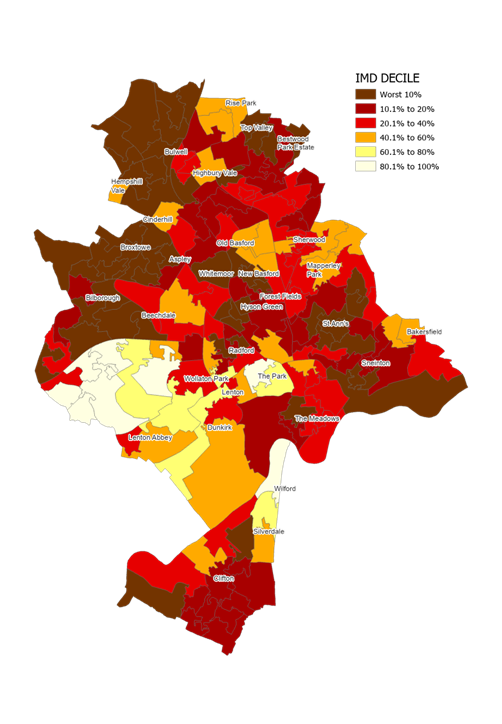
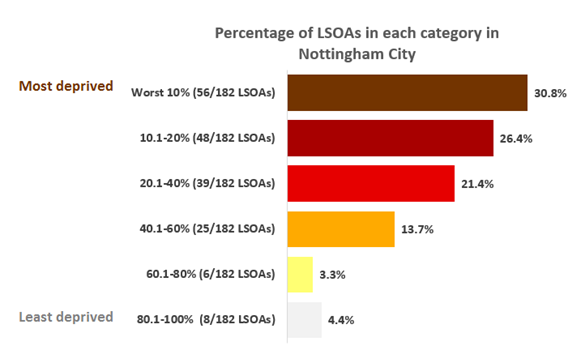
The chart below shows the percentage of LSOAs which fall into the different categories (Worst 10% which are the most deprived through to the least deprived categories 60.1-100%).
Nottingham City IMD 2019 results
Nottingham ranks 11th most deprived out of the 317 districts in England using the Average Score measure.
This compares with ranks of 8th in 2015, 20th in 2010 and 13th in the 2007 index.
Local Authorities which rank as more deprived than Nottingham using the Average Score measure are:
- Blackpool
- Knowsley
- Liverpool
- Kingston upon Hull
- Middlesbrough
- Manchester
- Birmingham
These all ranked as more deprived than the City in 2015, plus Burnley, Blackburn with Darwen and Hartlepool in 2019.
Nottingham ranks fourth most deprived of the Core Cities behind Liverpool (3rd out of 317); Manchester (6th) and Birmingham (7th). The others rank as follows: Newcastle upon Tyne (41st); Leeds (55th); Sheffield (57th); Bristol (65th).
The Index of Multiple Deprivation Lower Super Output Area Results
- 56 of the 182 (30.8%) City Lower Super Output Areas (LSOAs) fall amongst the 10% most deprived in the country.
- 104 fall in the 20% (57.1%) most deprived. This compares to 61 and 110 LSOAs in the 2015 indices.
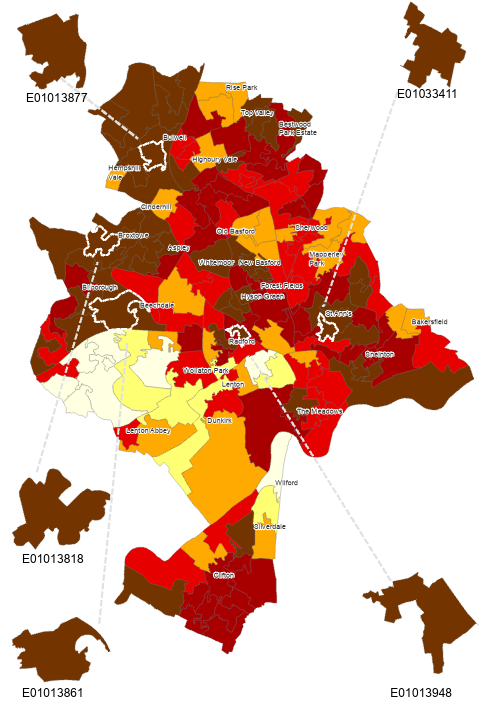
- The lowest ranking LSOA in the City is in Bulwell (E01013877), which ranks 130th nationally out of 32,844, but, unlike in 2015, no City LSOA ranks in the most deprived 100 LSOAs in the country.
- 8 LSOAs in the City rank in the 20% least deprived in the country.
- To find out the location of a particular LSOA, we have created a web app. Simply type in a LSOA code into the search box and the map will zoom to its location.
The table and map below shows the LSOAs most affected by Multiple Deprivation.
|
City Rank |
LSOA |
Location |
Ward |
National Rank 2019 |
|
1 |
E01013877 |
Bulwell Centre |
Bulwell |
130 |
|
2 |
E01013861 |
Bilborough East |
Bilborough |
145 |
|
3 |
E01013948 |
Radford Flats |
Radford |
207 |
|
4 |
E01013818 |
Broxtowe East |
Aspley |
265 |
|
5 |
E01033411 |
St Anns Plantagnet Street |
St Anns |
453 |
LSOAs in the 10% most deprived areas in Nottingham City
To find out all Lower Super Output Areas which fall in the 10% most deprived in Nottingham City please see the following dataset.
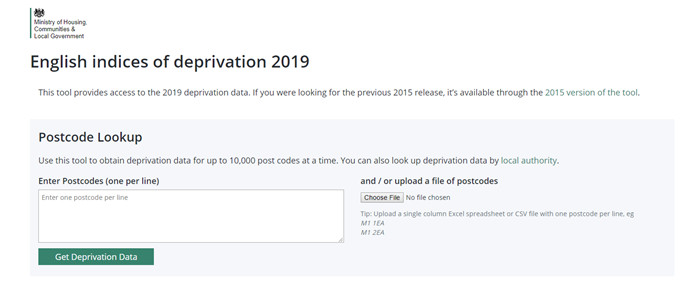
Indices of Deprivation by Postcode
The Ministry of Housing, Communities and Local Government have developed a useful tool which will help you understand the areas in which your customers live and the levels of deprivation in different areas.
- Either enter a postcode or a number of postcodes and the tool will return results for all the Indices of Deprivation for the LSOA in which the postcode falls.
- Or alternatively if you have a set of customer addresses upload these to the tool and the tool will return results for the Indices of Deprivation by LSOA.
- The results can then be exported as either an excel or CSV output. Please explore the tool by clicking on the image below.
Useful Links
Please see links below which include interactive tools to compare Nottingham City to other Local authorities and documents prepared by Local Government which explain the Indices of Deprivation in more detail.
- Deprivation documents on Nottingham Insight
- ID 2019 Interactive Dashboard for all Local Authorities
- Overview Infographic (2019) Gov.uk
- English indices of deprivation (2019) Gov.uk
- Interactive map - All Indices (2019)
- Frequently asked questions (Indices of Deprivation 2019)